
Tracking your infrastructure is as important as eating breakfast.
Everybody in the DevOps/Infrastructure community knows that monitoring your systems is an everyday effort. It never ends and covering it all can cause a headache.
At WSC Sports, we were able to construct an ecosystem to monitor all of our systems that made our lives much easier, and yes, we suffer from way less headaches. Now that we have this system, why keep it to ourselves when we can share it with the world?
In this post I’ll explain how investing in some quick, but crucial, steps will improve your workflow in a snap of your fingers — on the keyboard of course 😉

First, it is recommended that you write down your main systems and components and spot the weaknesses in your current ecosystem that you want to address.
Let’s use our ecosystem as an example.
What do we do? WSC Sports helps media rights owners maximize their content with near real-time, automated video solutions. We are running our infra on Microsoft Azure and orchestrate our containers on Kubernetes, running DB such as SQL and Redis.
How did we do it?
An important key for your monitoring to work is to have it all under one roof, so try to integrate your metrics into one system if possible. A great tool to use is Grafana, which is what we used. According to Wiki Archlinux, Grafna is “an open-source, general-purpose dashboard and graph composer.”
So we integrated our Grafana login with Azure Active Directory making it easier and more secure for everybody to login.
If you need any help connecting your Azure account, check out this guide: remember that you can connect with any OAuth Authentication.
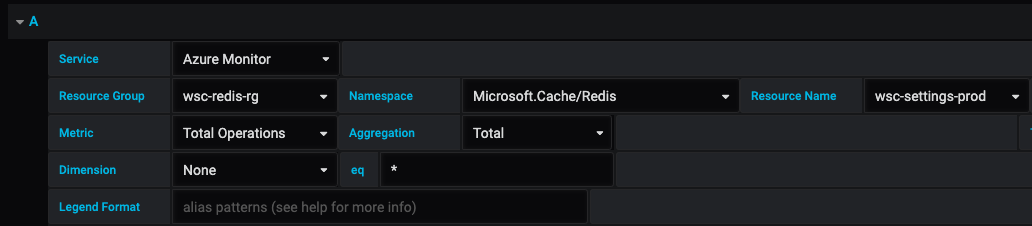
Monitoring our Azure environment was never that easy. So one of the first things I did was utilize Grafana’s easy-to-install plugin called Azure Monitor , which is used as a DataSource.
All you need to do is supply your Azure account details and you’re good to go.
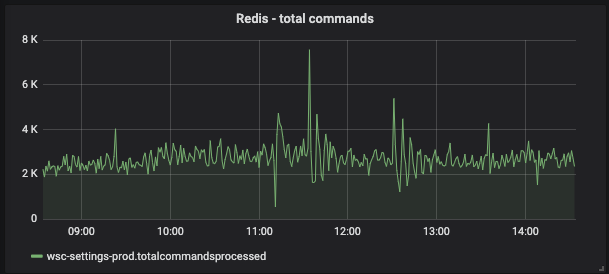
Setting this up will instantly give you the ability to get all of your Azure metrics into Grafana. It should look like this:
Next up, Kubernetes:
We use Kubernetes as our containers orchestrator, we have multiple clusters and it runs crucial workloads. Getting metrics to Grafana is possible with Prometheus. Install it quickly using helm chart and expose your service to your Grafana. Later, configure a new Prometheus DataSource on Grafana.
Prometheus uses PromQL as a query language. To make it more robust and general you can use it with variables on Grafana. This way you can use one dashboard to display multiple clusters, namespace, etc. For example :
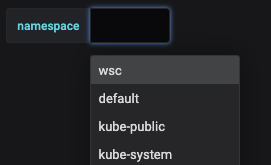
Using variables makes it easier to change the data, for example, we have an overview page that we use to switch between the clusters.
Grafana has a great community — you can copy dashboards in just a few clicks. We also used a few Kubernetes ready-to-deploy dashboards, you can check them out here.
All you have to do to copy the dashboard is copy the ID and paste it into your Grafana.
It’s all that simple.
It took us only a few days to compile all of our dashboards, and the impact it has on a daily basis is unbelievable. We are actively monitoring and are more in control of our infrastructure all in one spot, saving us valuable time which can now be put to better use.